CASH Simulation, Part 5: pFDP Variability
Lei Sun
2017-11-15
Last updated: 2017-12-21
Code version: 6e42447
Introduction
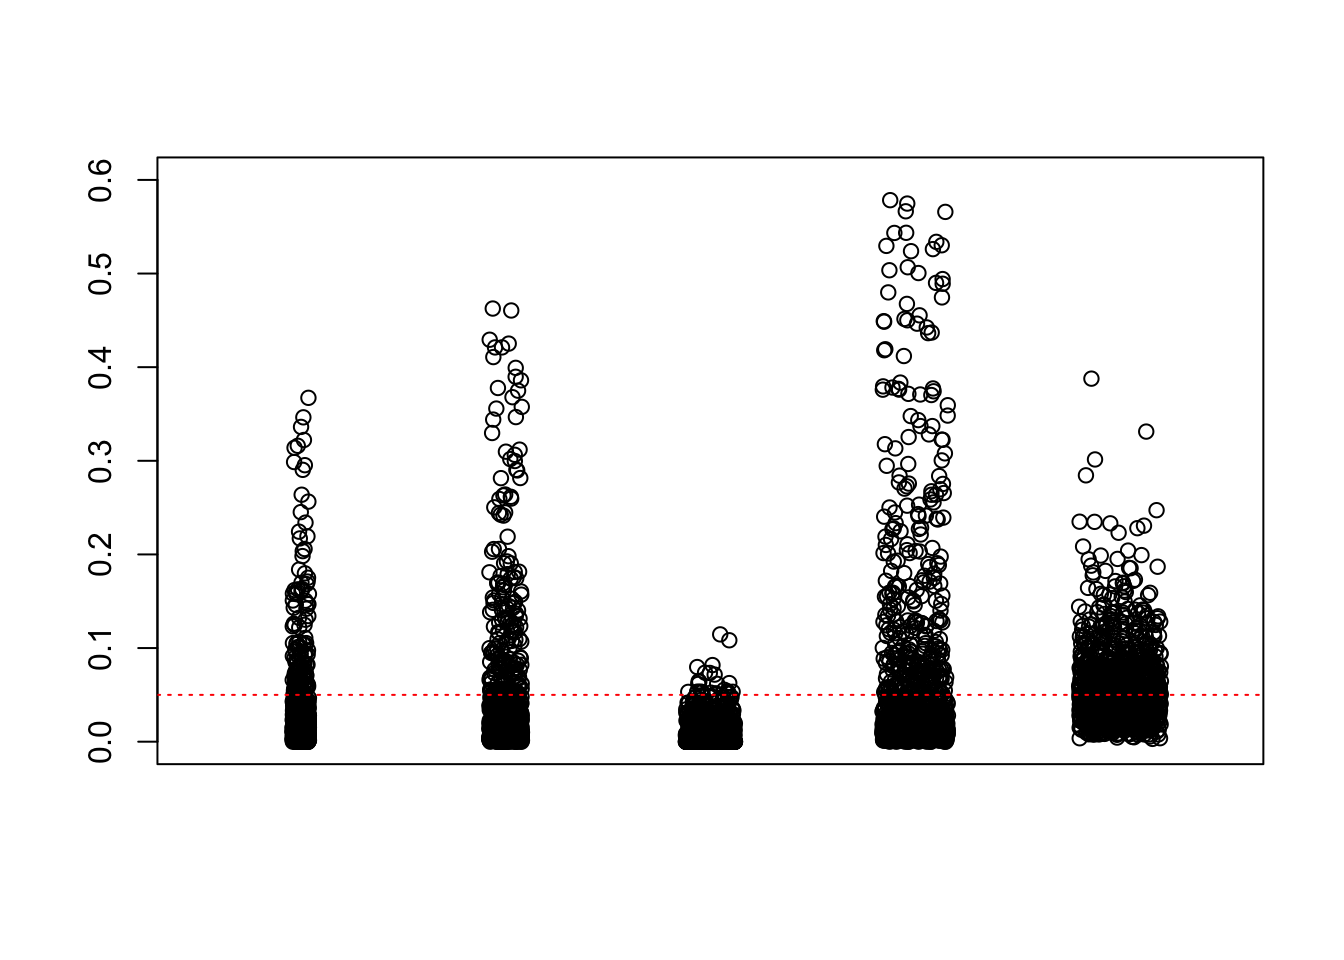
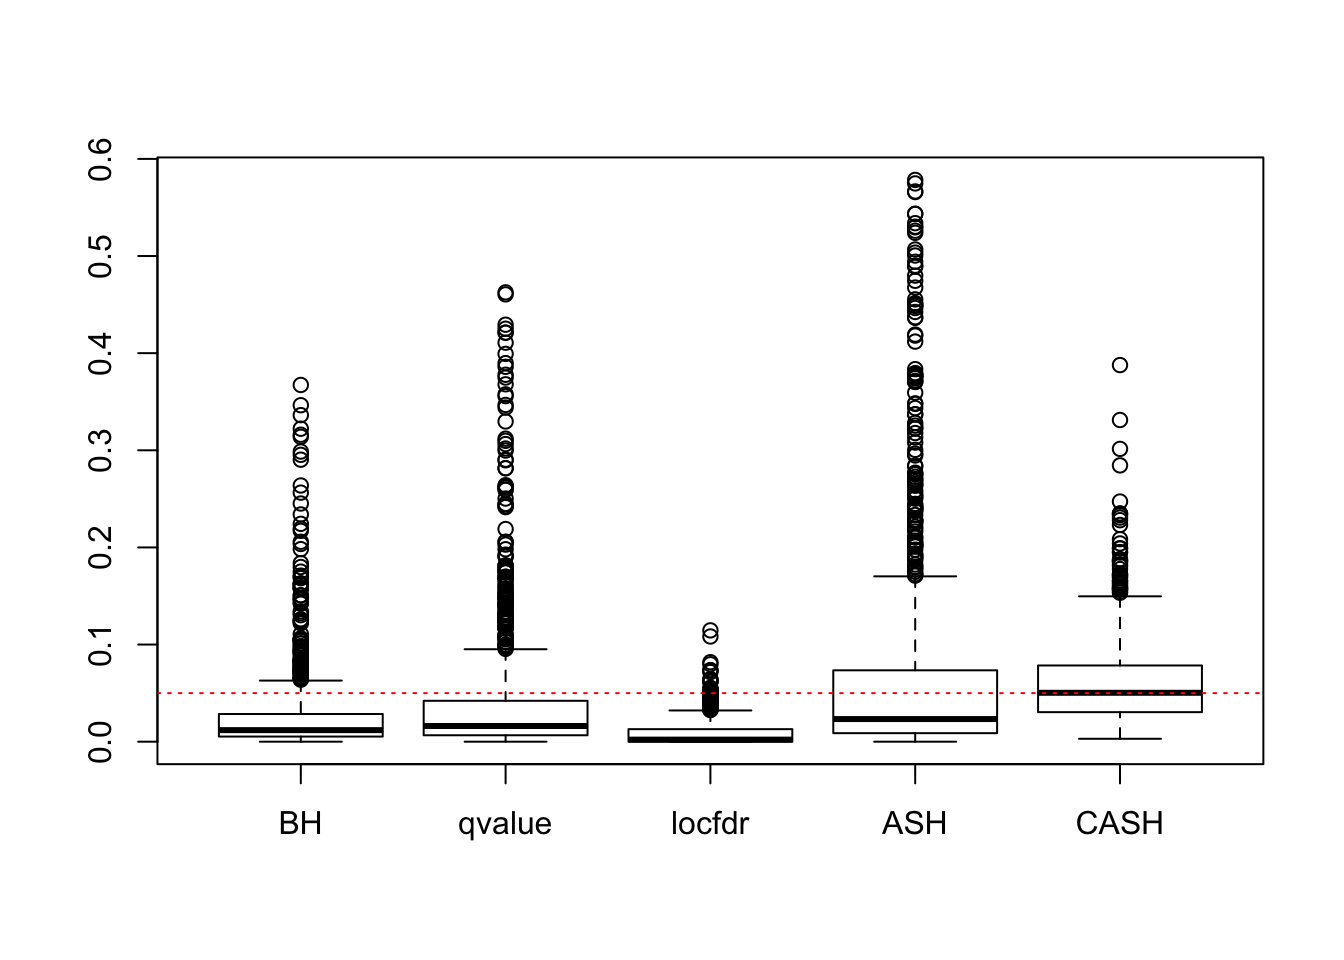
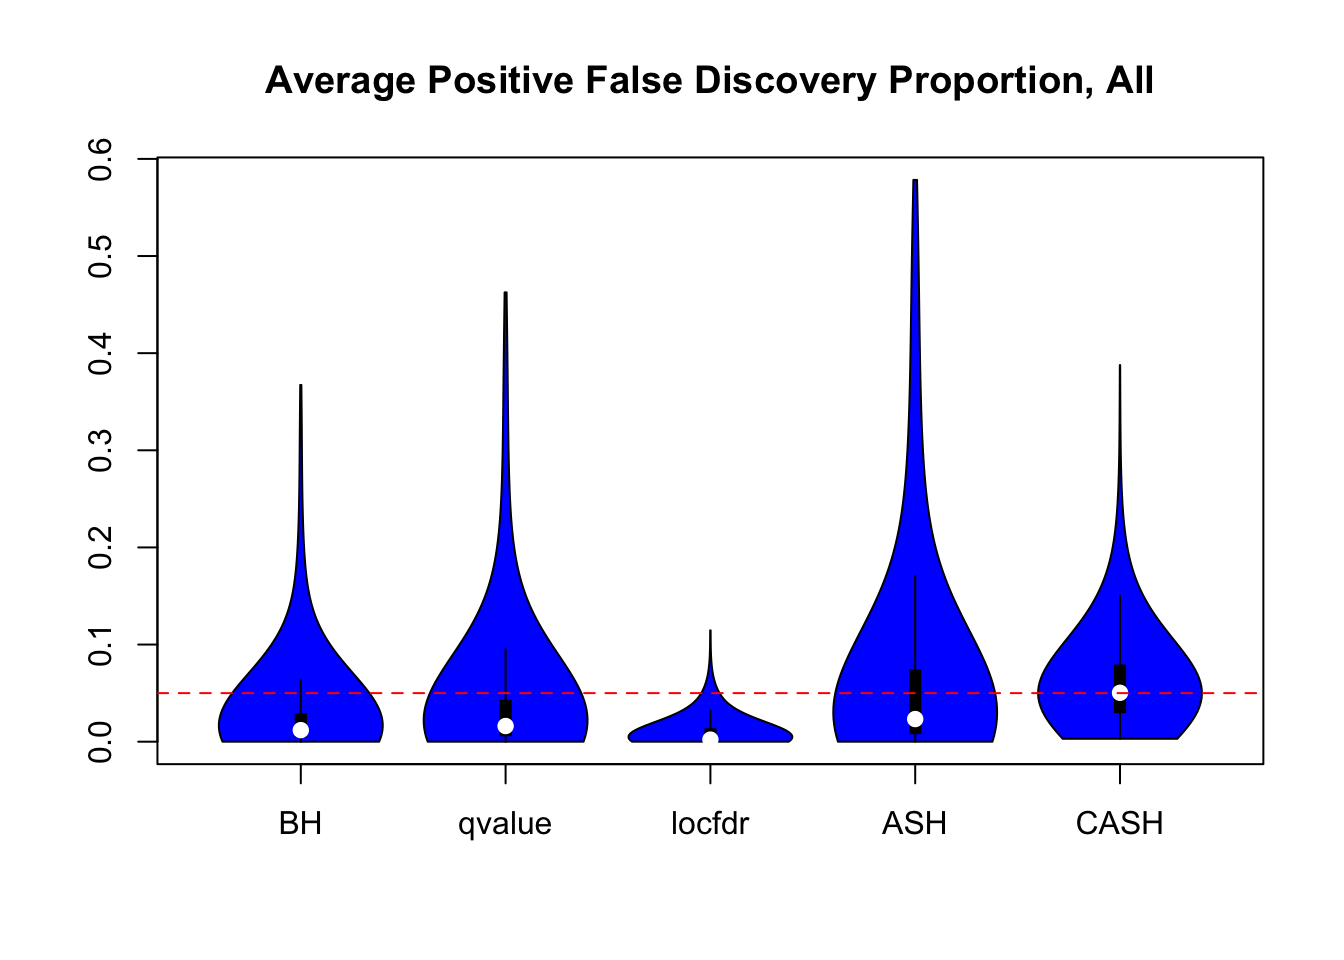
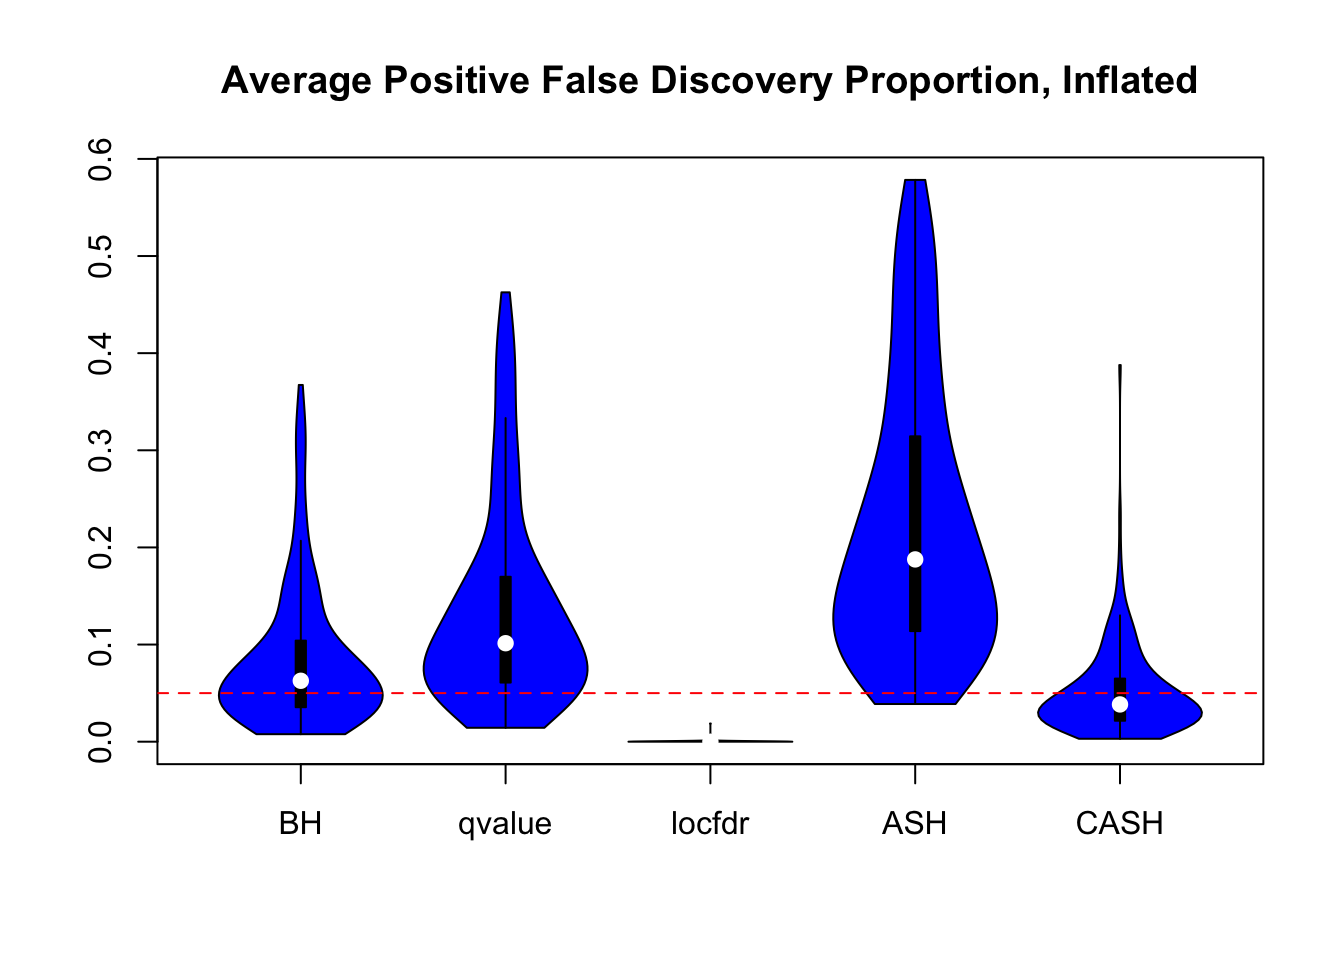
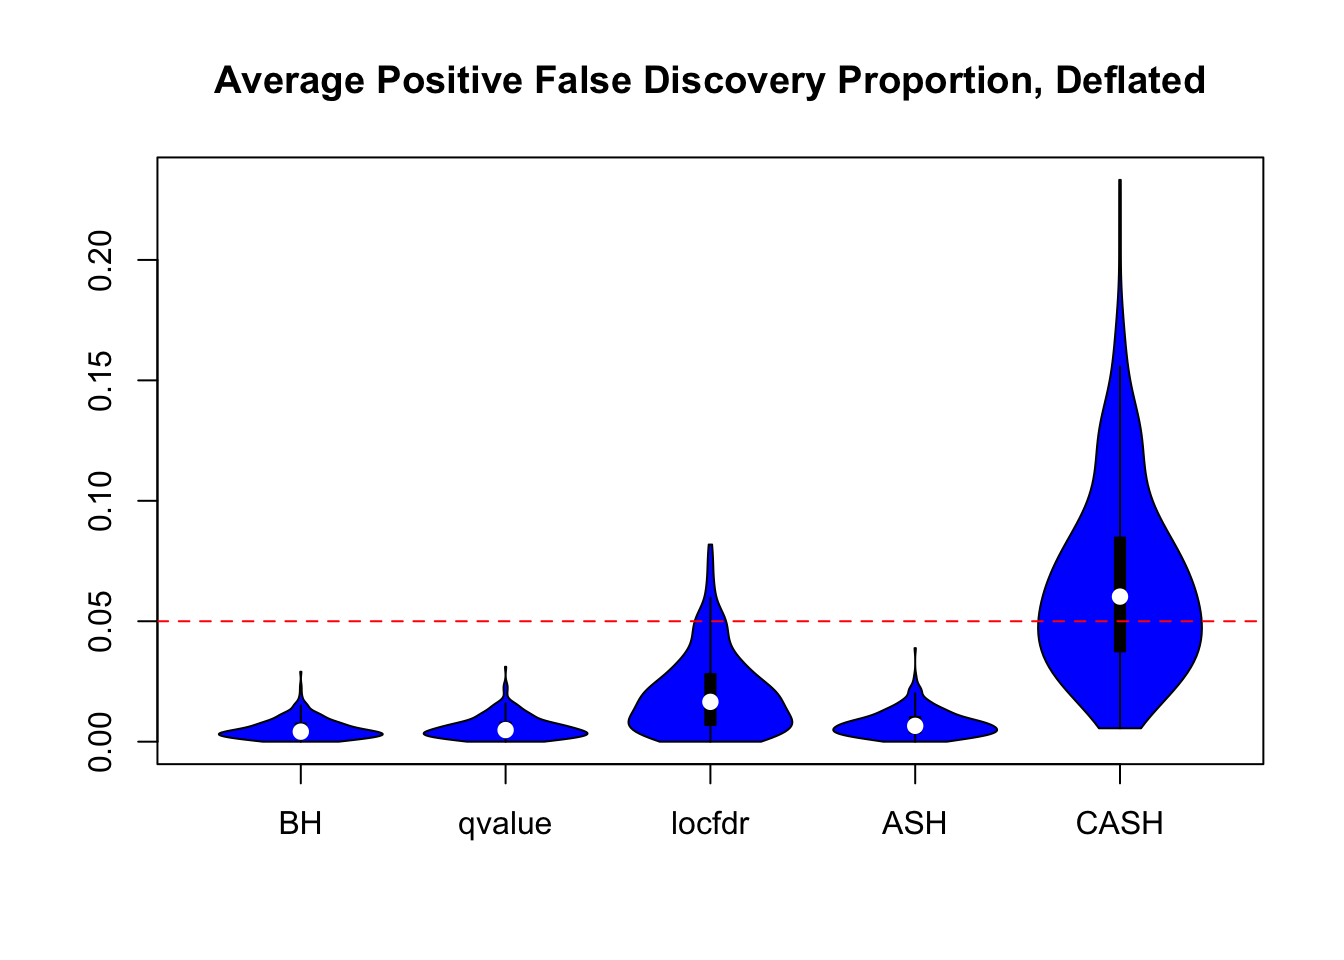
We are using the data obtained from the large-scale simulation with real data to show the variability of the positive false discovery proportions obtained by different methods at nominal \(q\) value $ = 0.05$. The true effect distribution is \(0.6\delta_0 + 0.3N(0, 1) + 0.1N(0, 2^2)\).
z.mat <- readRDS("../output/z_null_liver_777.rds")
se.mat <- readRDS("../output/sebetahat_null_liver_777.rds")
beta.list <- readRDS("../output/beta.list.rds")
qvalue.list <- readRDS("../output/qvalue.list.rds")
qvalue.BH <- qvalue.list$qvalue.BH
qvalue.qvalue <- qvalue.list$qvalue.qvalue
qvalue.locfdr <- qvalue.list$qvalue.locfdr
qvalue.ash <- qvalue.list$qvalue.ash
qvalue.gdash <- qvalue.list$qvalue.gdash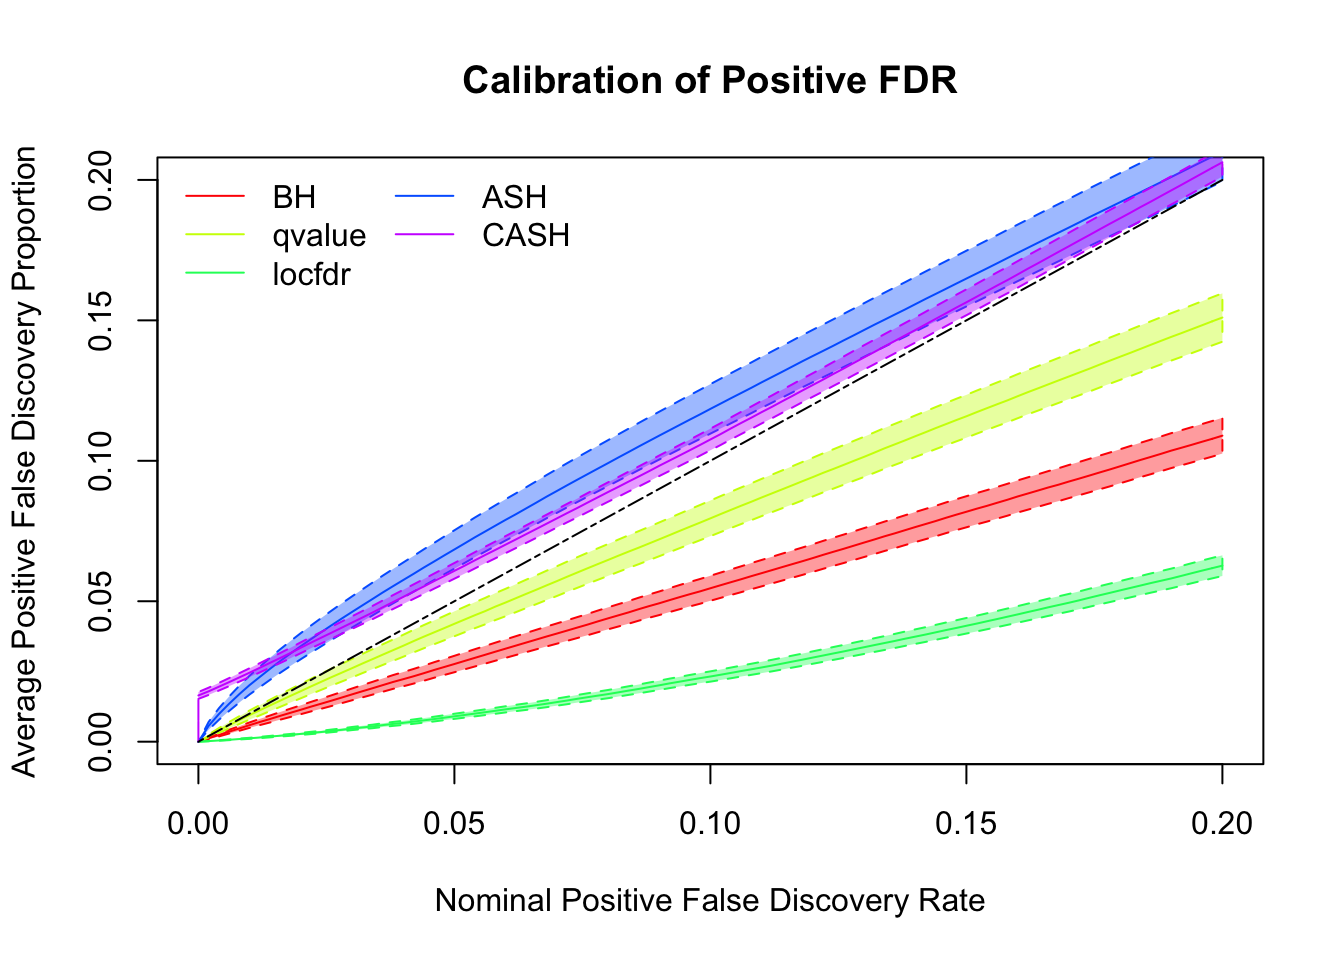
Session information
sessionInfo()R version 3.4.3 (2017-11-30)
Platform: x86_64-apple-darwin15.6.0 (64-bit)
Running under: macOS High Sierra 10.13.2
Matrix products: default
BLAS: /Library/Frameworks/R.framework/Versions/3.4/Resources/lib/libRblas.0.dylib
LAPACK: /Library/Frameworks/R.framework/Versions/3.4/Resources/lib/libRlapack.dylib
locale:
[1] en_US.UTF-8/en_US.UTF-8/en_US.UTF-8/C/en_US.UTF-8/en_US.UTF-8
attached base packages:
[1] stats graphics grDevices utils datasets methods base
other attached packages:
[1] vioplot_0.2 sm_2.2-5.4
loaded via a namespace (and not attached):
[1] compiler_3.4.3 backports_1.1.2 magrittr_1.5 rprojroot_1.3-1
[5] tools_3.4.3 htmltools_0.3.6 yaml_2.1.16 Rcpp_0.12.14
[9] stringi_1.1.6 rmarkdown_1.8 knitr_1.17 git2r_0.20.0
[13] stringr_1.2.0 digest_0.6.13 evaluate_0.10.1This R Markdown site was created with workflowr