Semicircular correlated \(z\) scores
Lei Sun
2017-06-07
Last updated: 2017-12-21
Code version: 6e42447
Data generation
Let \(L_{n \times k} = \left[L_{ij}\right]_{n \times k}\) be a matrix, each entry of which is generated as follows.
- Let \(L_{ij} \sim N(0, 1)\) independently.
- Let \(L_{ij} = \displaystyle\frac {L_{ij}}{\sqrt{L_{i1}^2 + \cdots + L_{ik}^2}}\). That is, normalizing each row so that each row has a unit \(l_2\) norm.
Then taking \(L\) as known, let \(x \sim N\left(0, I_k\right)\) be a \(k\)-dimensional vector comprised of \(k\) independent \(N\left(0, 1\right)\) random variables. Then \[ z = Lx \sim N\left(0, LL^T\right) \] should be \(n\) marginally \(N\left(0, 1\right)\) but correlated \(z\) scores. Indeed, \[ \begin{array}{c} \text{var}\left(z_i\right) = l_i^Tl_i = 1 \ ; \\ \text{cov}\left(z_i, z_j\right) = l_i^Tl_j \neq 0 \text{, in general} \ ; \end{array} \] where \(l_i^T\) and \(l_j^T\) are \(i^\text{th}\) and \(j^\text{th}\) rows of \(L\) respectively.
Then we plot the histogram of \(n\) \(z\) scores. One interesting thing is we can prove what these histograms would look like when \(n\) is sufficiently large.
\(k = 4\)
For example, when \(k = 4\), \(n\) is sufficiently large, say, \(10^6\), the histogram of \(z\) looks like a semicircle almost perfectly, as illustrated in the following simulation. The semicircle is centered at the origin, and has a radius of \(\left\|x\right\|_2\).
set.seed(1)
n = 1e6
k = 4
L = matrix(rnorm(n * k), nrow = n)
s = sqrt(rowSums(L^2))
L = L / s
x = rnorm(k)
z = L %*% x
hist(z, breaks = 100, prob = TRUE)
R = sqrt(sum(x^2))
x.plot = seq(-max(abs(z)) - 1, max(abs(z)) + 1, length = 1000)
y.plot = 2 * sqrt(pmax(R^2 - x.plot^2, 0)) / (pi * R^2)
lines(x.plot, y.plot, col = "red")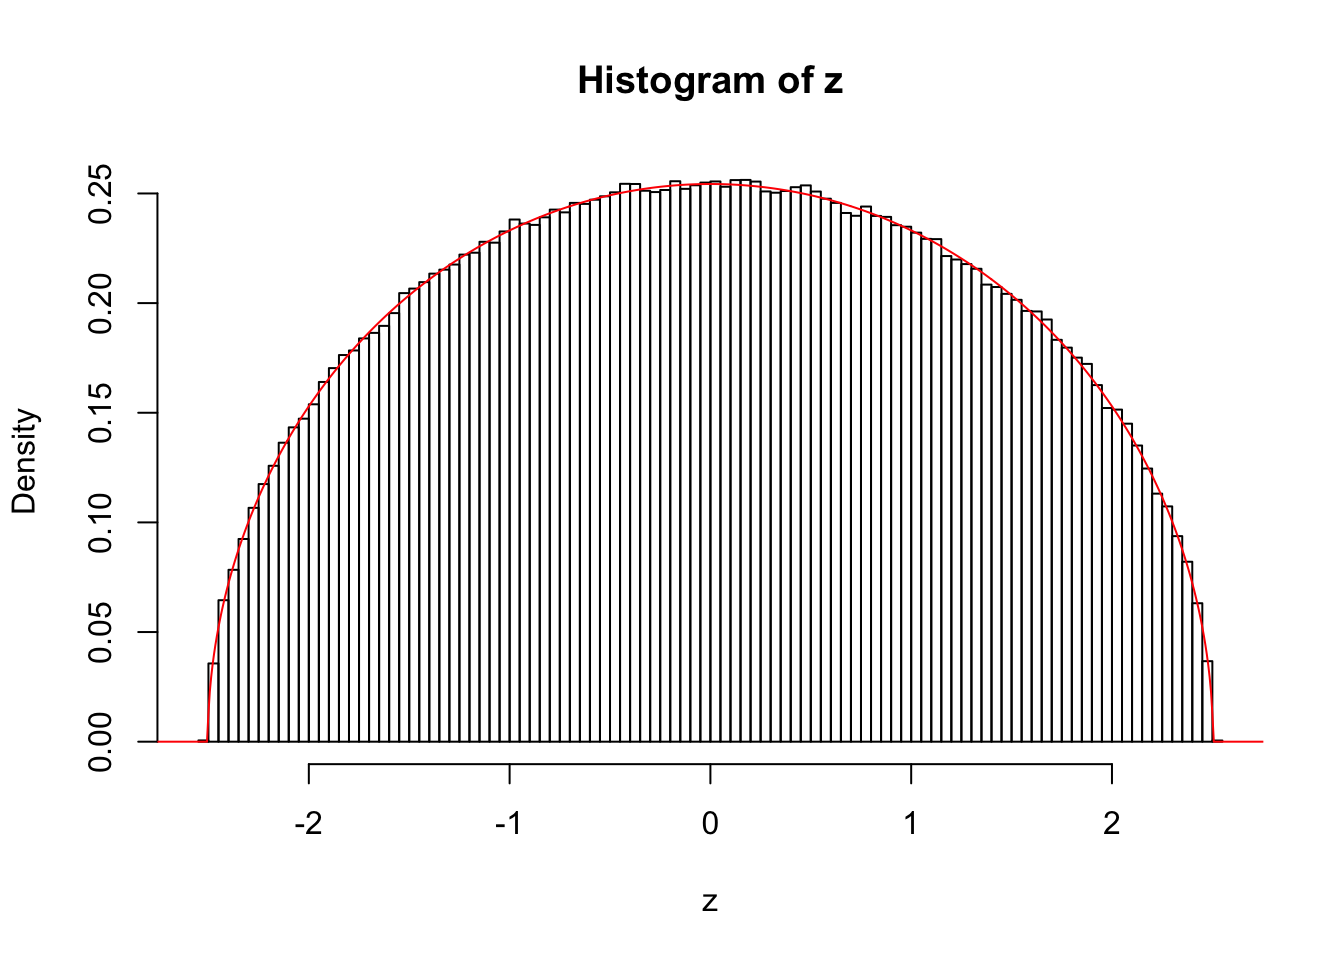
Actually, when \(k \neq 4\), for example, \(k = 3\) or \(k = 5\), the histograms of these correlated \(z\) scores, simulated the same way, look different, and their shapes when \(n \to \infty\) can be mathematically determined.
\(k = 3\)
set.seed(1)
n = 1e6
k = 3
L = matrix(rnorm(n * k), nrow = n)
s = sqrt(rowSums(L^2))
L = L / s
x = rnorm(k)
z = L %*% x
hist(z, breaks = 100, prob = TRUE)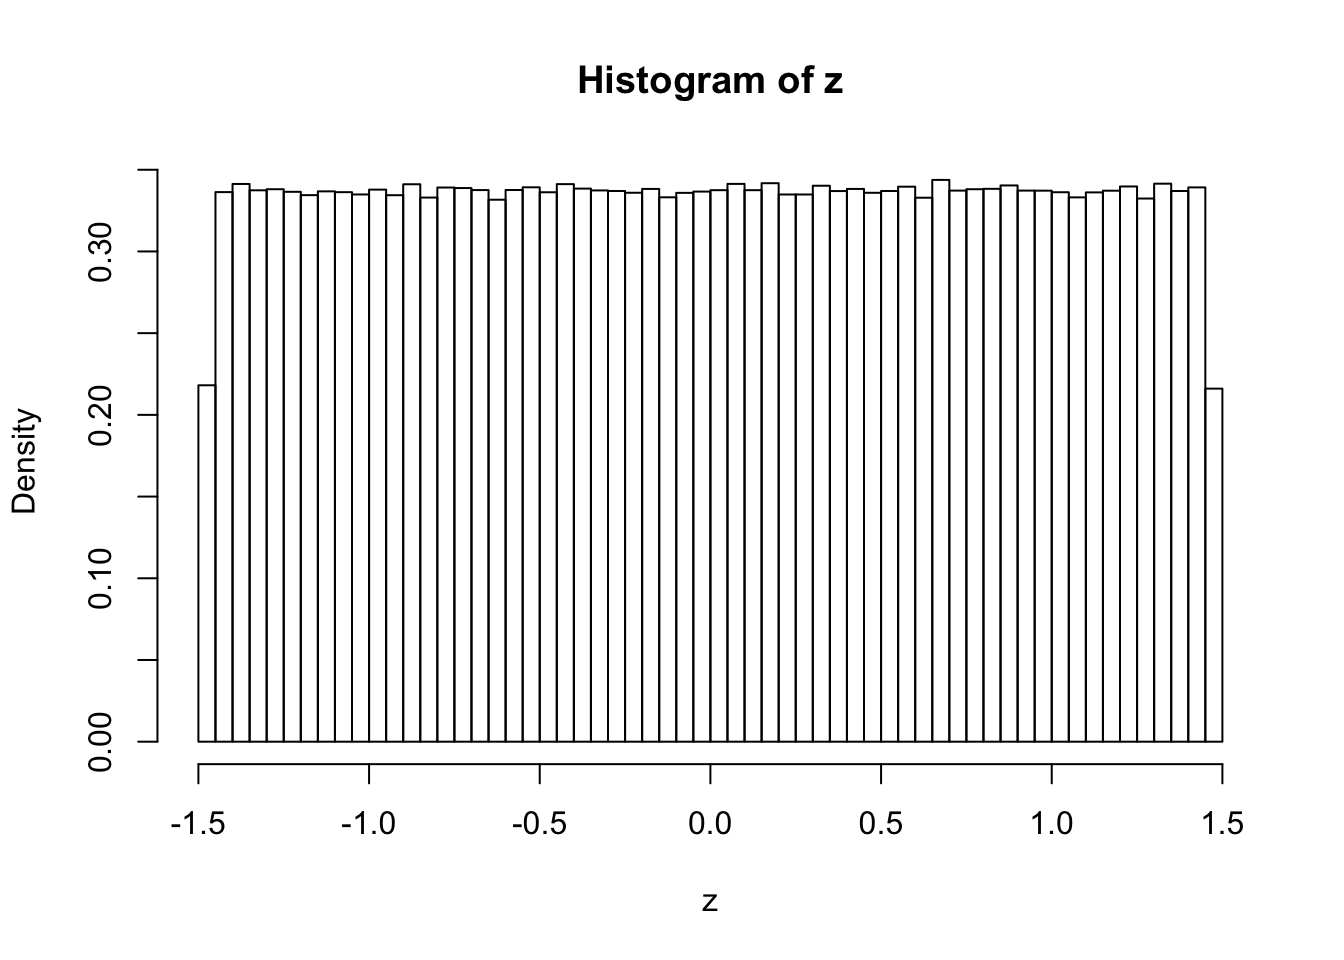
\(k = 5\)
set.seed(1)
n = 1e6
k = 5
L = matrix(rnorm(n * k), nrow = n)
s = sqrt(rowSums(L^2))
L = L / s
x = rnorm(k)
z = L %*% x
hist(z, breaks = 100, prob = TRUE)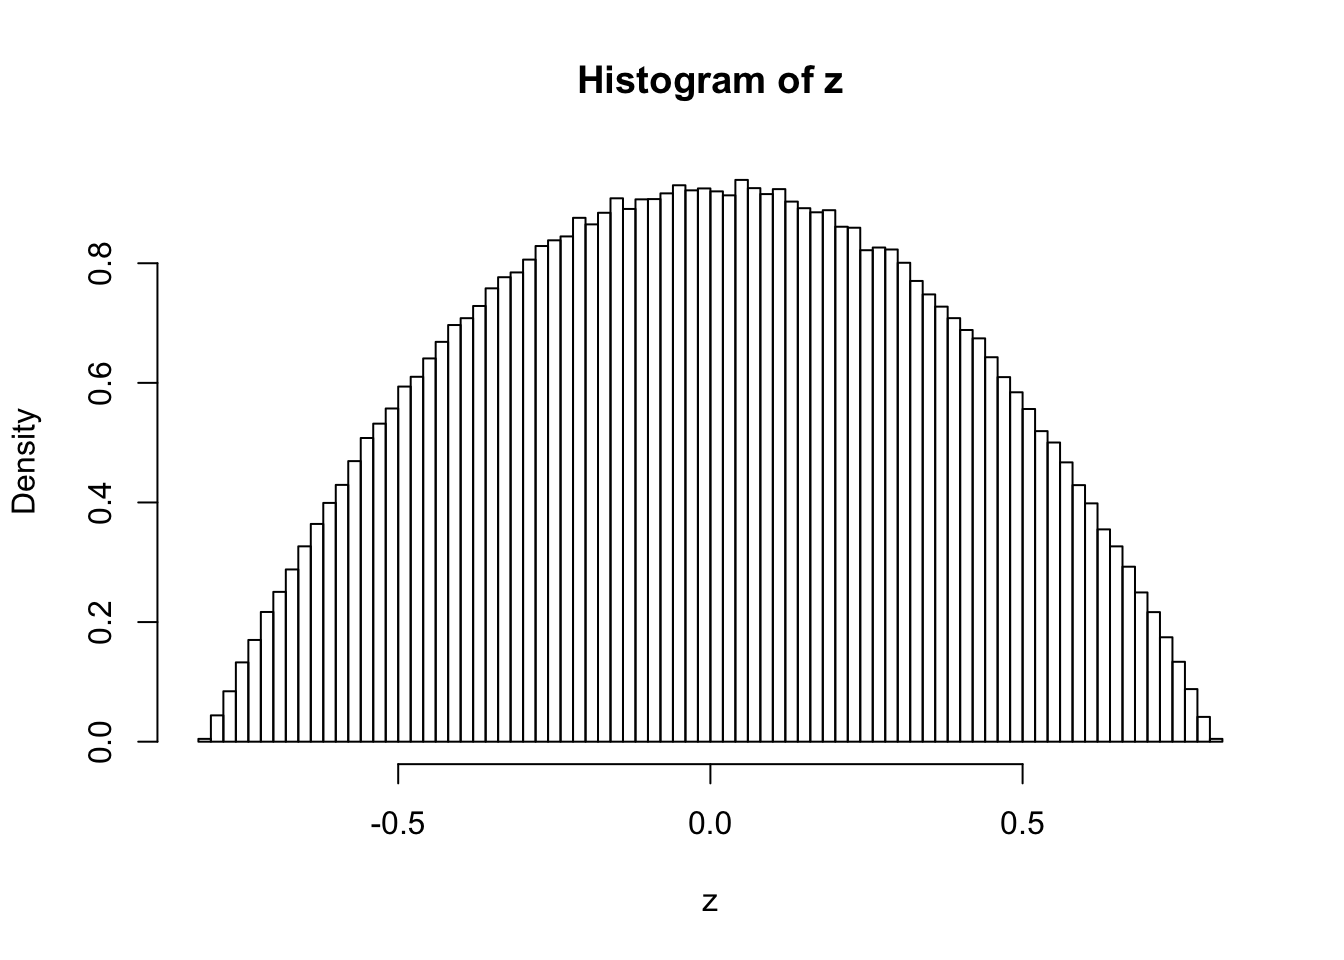
Session information
sessionInfo()R version 3.4.3 (2017-11-30)
Platform: x86_64-apple-darwin15.6.0 (64-bit)
Running under: macOS High Sierra 10.13.2
Matrix products: default
BLAS: /Library/Frameworks/R.framework/Versions/3.4/Resources/lib/libRblas.0.dylib
LAPACK: /Library/Frameworks/R.framework/Versions/3.4/Resources/lib/libRlapack.dylib
locale:
[1] en_US.UTF-8/en_US.UTF-8/en_US.UTF-8/C/en_US.UTF-8/en_US.UTF-8
attached base packages:
[1] stats graphics grDevices utils datasets methods base
loaded via a namespace (and not attached):
[1] compiler_3.4.3 backports_1.1.2 magrittr_1.5 rprojroot_1.3-1
[5] tools_3.4.3 htmltools_0.3.6 yaml_2.1.16 Rcpp_0.12.14
[9] stringi_1.1.6 rmarkdown_1.8 knitr_1.17 git2r_0.20.0
[13] stringr_1.2.0 digest_0.6.13 evaluate_0.10.1This R Markdown site was created with workflowr