Gaussian derivatives applied to Smemo’s data
Lei Sun
2017-06-14
Last updated: 2017-12-21
Code version: 6e42447
Introduction
Smemo et al 2014 provides a mouse heart RNA-seq data set. The data set contains 2 conditions, and each condition has only 2 samples. We’ll see if Gaussian derivatives can handle this difficult situation.
counts = read.table("../data/smemo.txt", header = T, row.name = 1)
counts = counts[, -5]
## Number of genes
nrow(counts)[1] 23587## Number of samples
ncol(counts)[1] 4## Sneak peek
head(counts, 10) lv1 lv2 rv1 rv2
Itm2a 2236 2174 9484 10883
Sergef 97 90 341 408
Fam109a 383 314 1864 2384
Dhx9 2688 2631 18501 20879
Ssu72 762 674 2806 3435
Olfr1018 0 0 0 0
Fam71e2 0 0 0 0
Eif2b2 736 762 3081 3601
Mks1 77 82 398 685
Hebp2 203 205 732 921Preprocessing
In the first exploratory investigation, we only choose genes whose expression levels are not all zero for all 4 samples. This is to prevent the complications brought by “non-expressed” genes.
counts.nonzero = counts[rowSums(counts) >= 1, ]
## Equivalently
## counts.nonzero = counts[apply(counts, 1, max) >= 1, ]
design = model.matrix(~c(0, 0, 1, 1))
## Number of genes expressed
nrow(counts.nonzero)
[1] 18615Then we feed the count matrix to the pipeline to get the summary statistics: \(\hat\beta\), \(\hat s\), \(z\).
counts_to_summary = function (counts, design) {
  dgecounts = edgeR::calcNormFactors(edgeR::DGEList(counts = counts, group = design[, 2]))
  v = limma::voom(dgecounts, design, plot = FALSE)
  lim = limma::lmFit(v)
  r.ebayes = limma::eBayes(lim)
  p = r.ebayes$p.value[, 2]
  t = r.ebayes$t[, 2]
  z = sign(t) * qnorm(1 - p/2)
  betahat = lim$coefficients[,2]
  sebetahat = betahat / z
  return (list(betahat = betahat, sebetahat = sebetahat, z = z))
}
Fitting \(z\) with Gaussian derivatives
Suppose \(z\) are correlated null, will they be well fitted by 10 Gaussian derivatives?
source("../code/gdash.R")
source("../code/gdfit.R")
w.fit = gdfit(z, gd.ord = 10)
plot.gdfit(z, w.fit$w, w.fit$gd.ord, breaks = 100)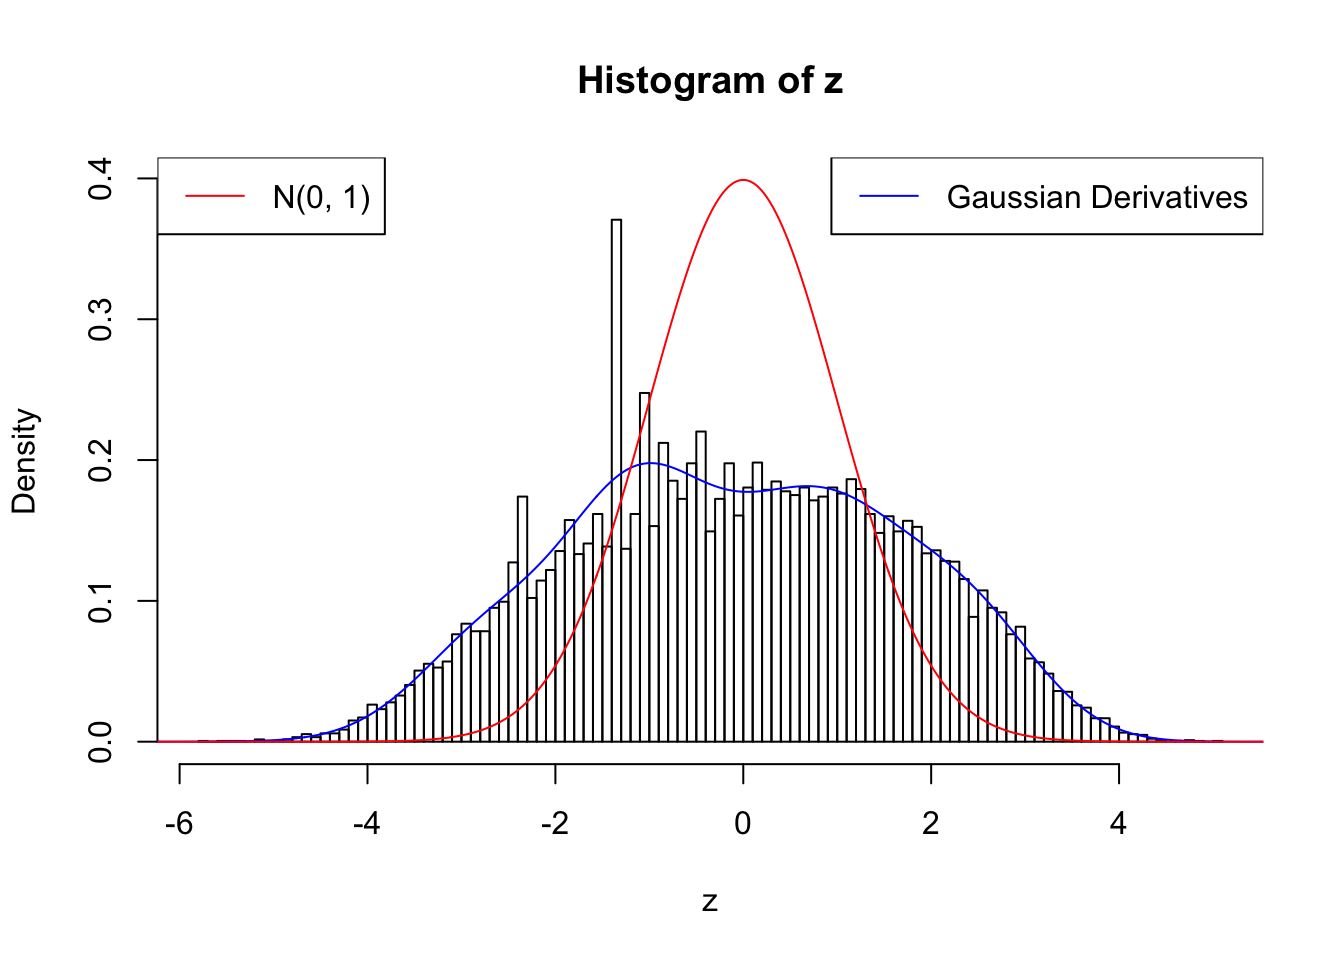
plot.gdfit(z, w.fit$w, w.fit$gd.ord, std.norm = FALSE, breaks = 100)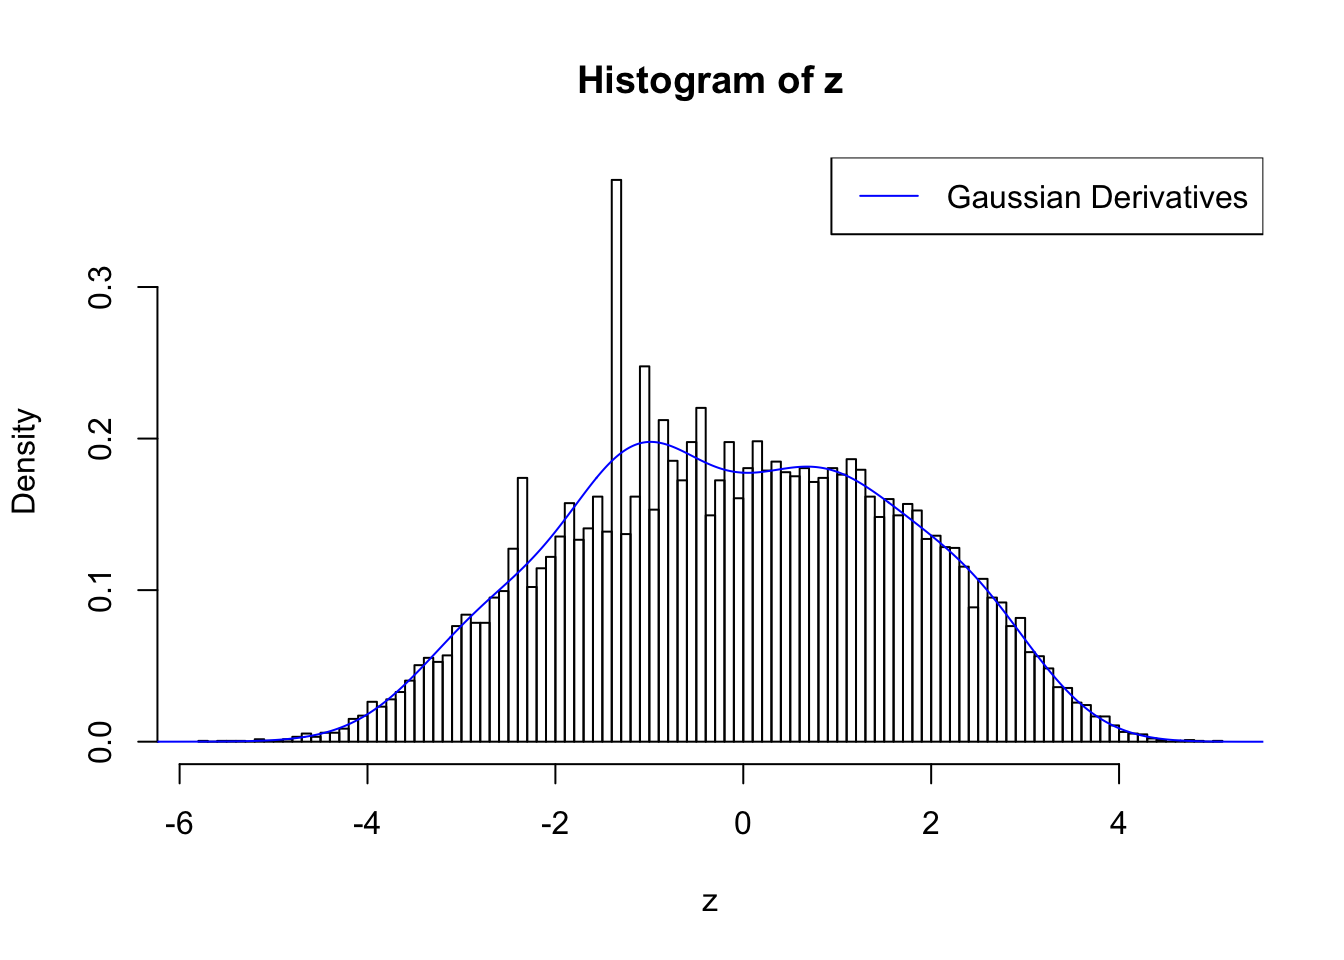
plot(ecdf(z))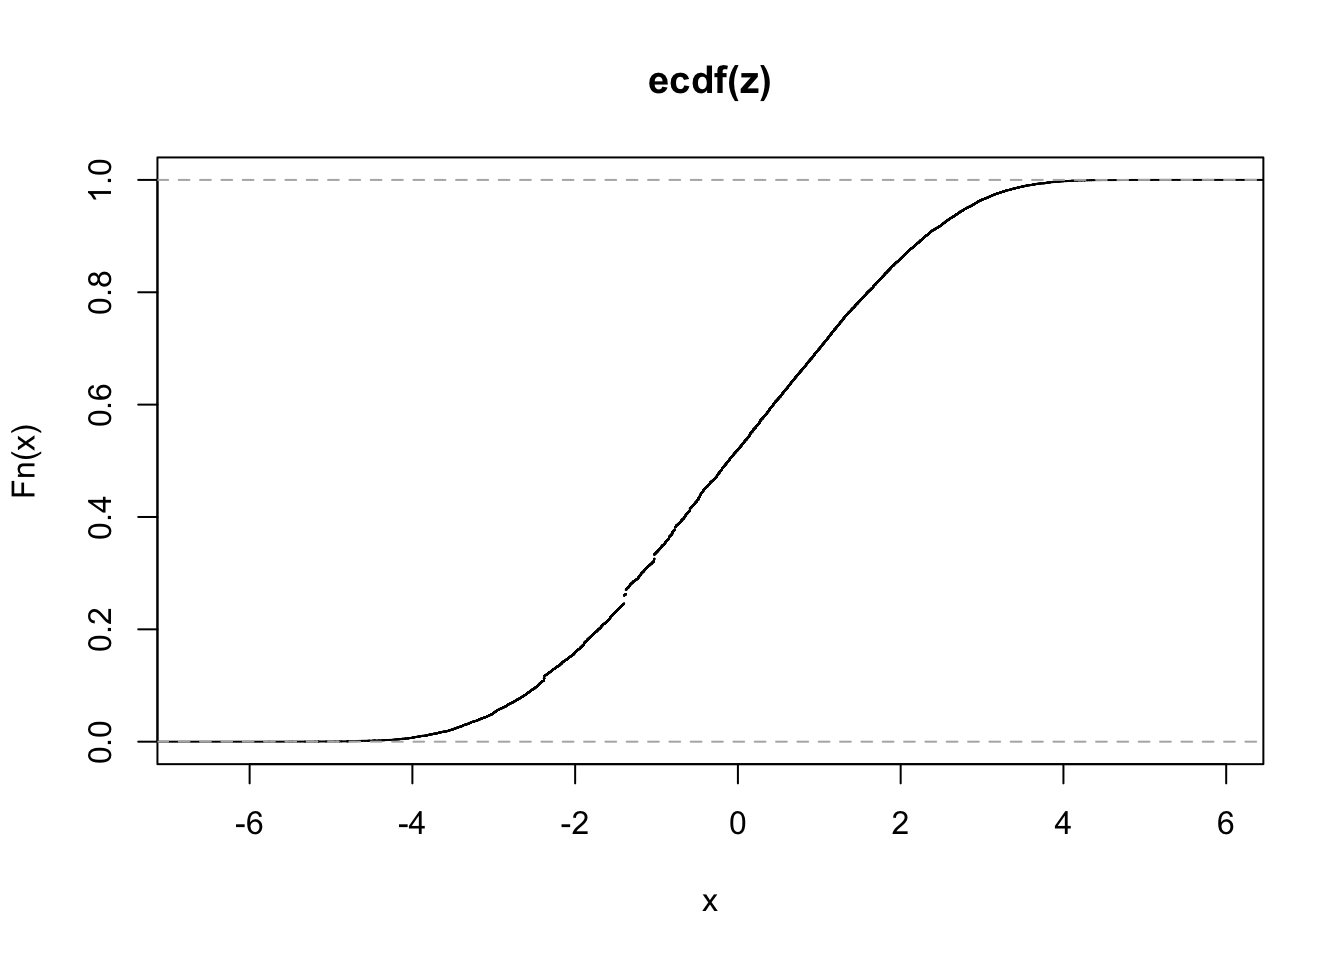
plot.gdfit(z, w.fit$w, w.fit$gd.ord, breaks = "Sturges")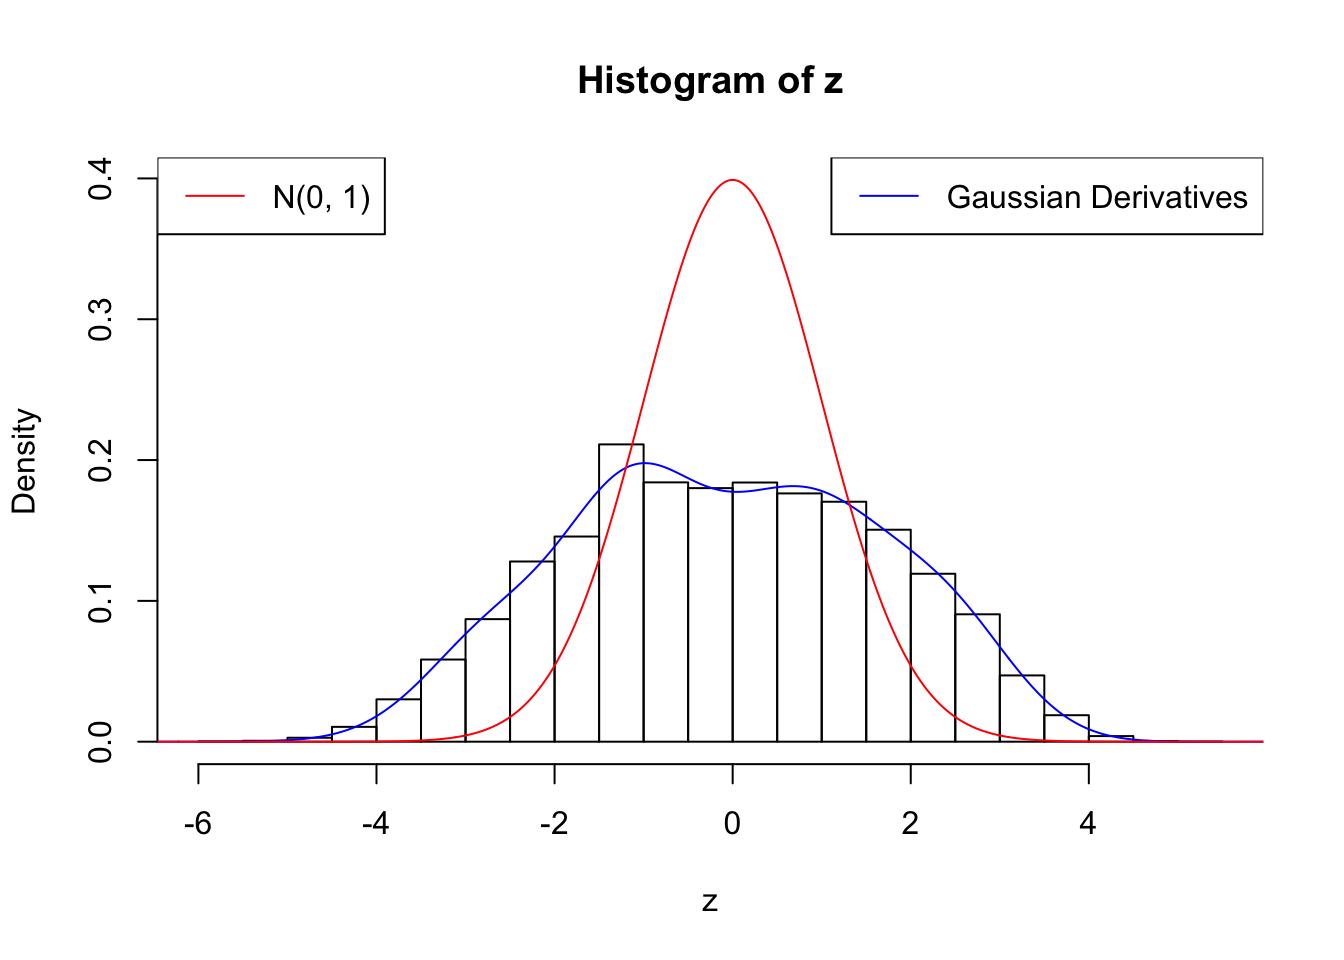
plot.gdfit(z, w.fit$w, w.fit$gd.ord, std.norm = FALSE, breaks = "Sturges")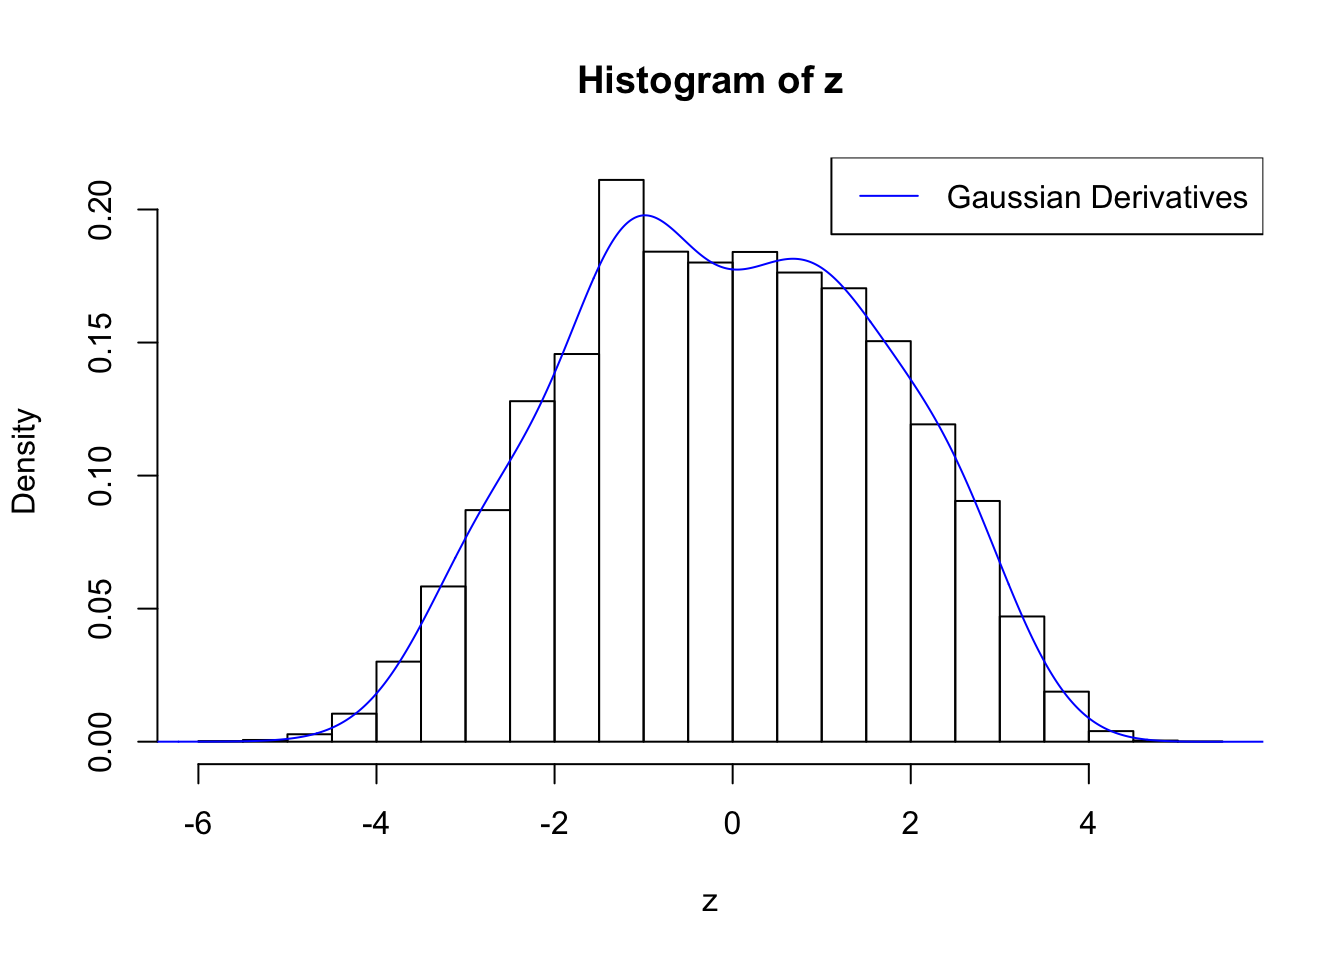
Remove two peaks
## Remove all singletons
counts.nonsingleton = counts[rowSums(counts) > 1, ]
## Number of non-singleton genes
nrow(counts.nonsingleton)
[1] 18075w.fit = gdfit(z, gd.ord = 10)
plot.gdfit(z, w.fit$w, w.fit$gd.ord, breaks = 100)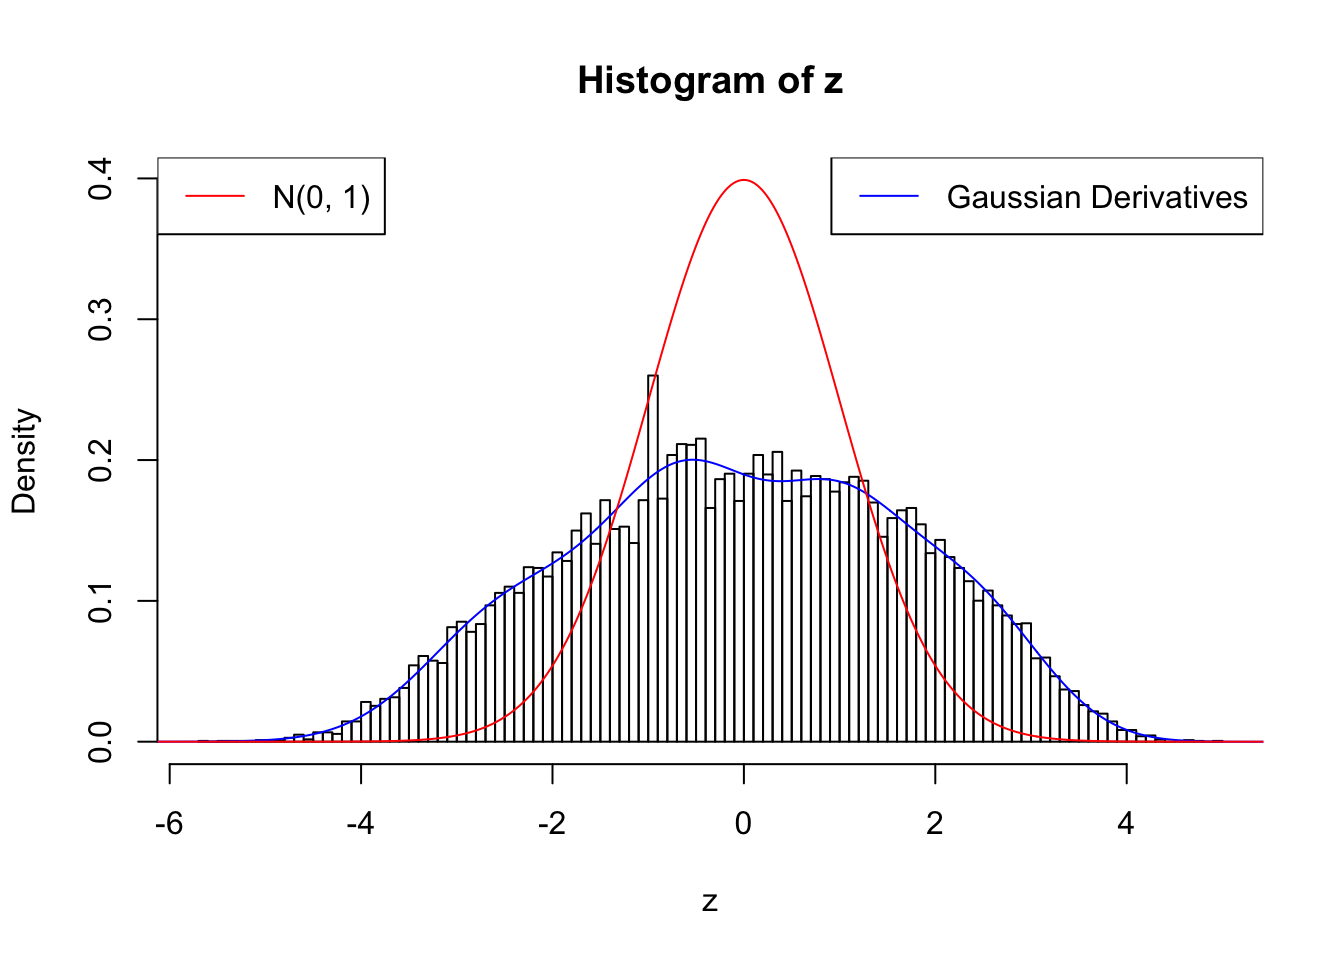
plot.gdfit(z, w.fit$w, w.fit$gd.ord, std.norm = FALSE, breaks = 100)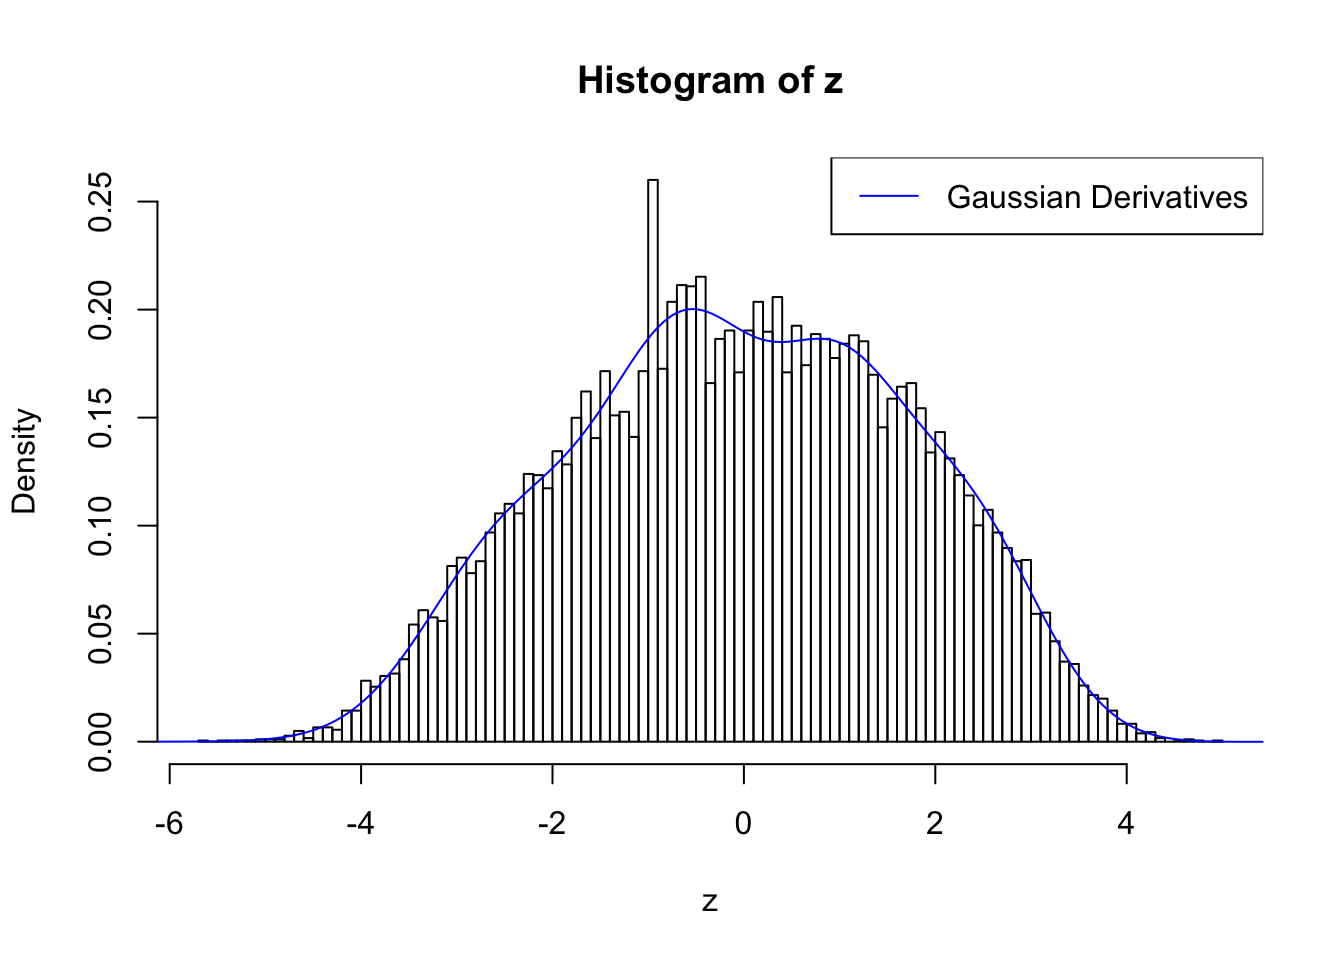
plot(ecdf(z))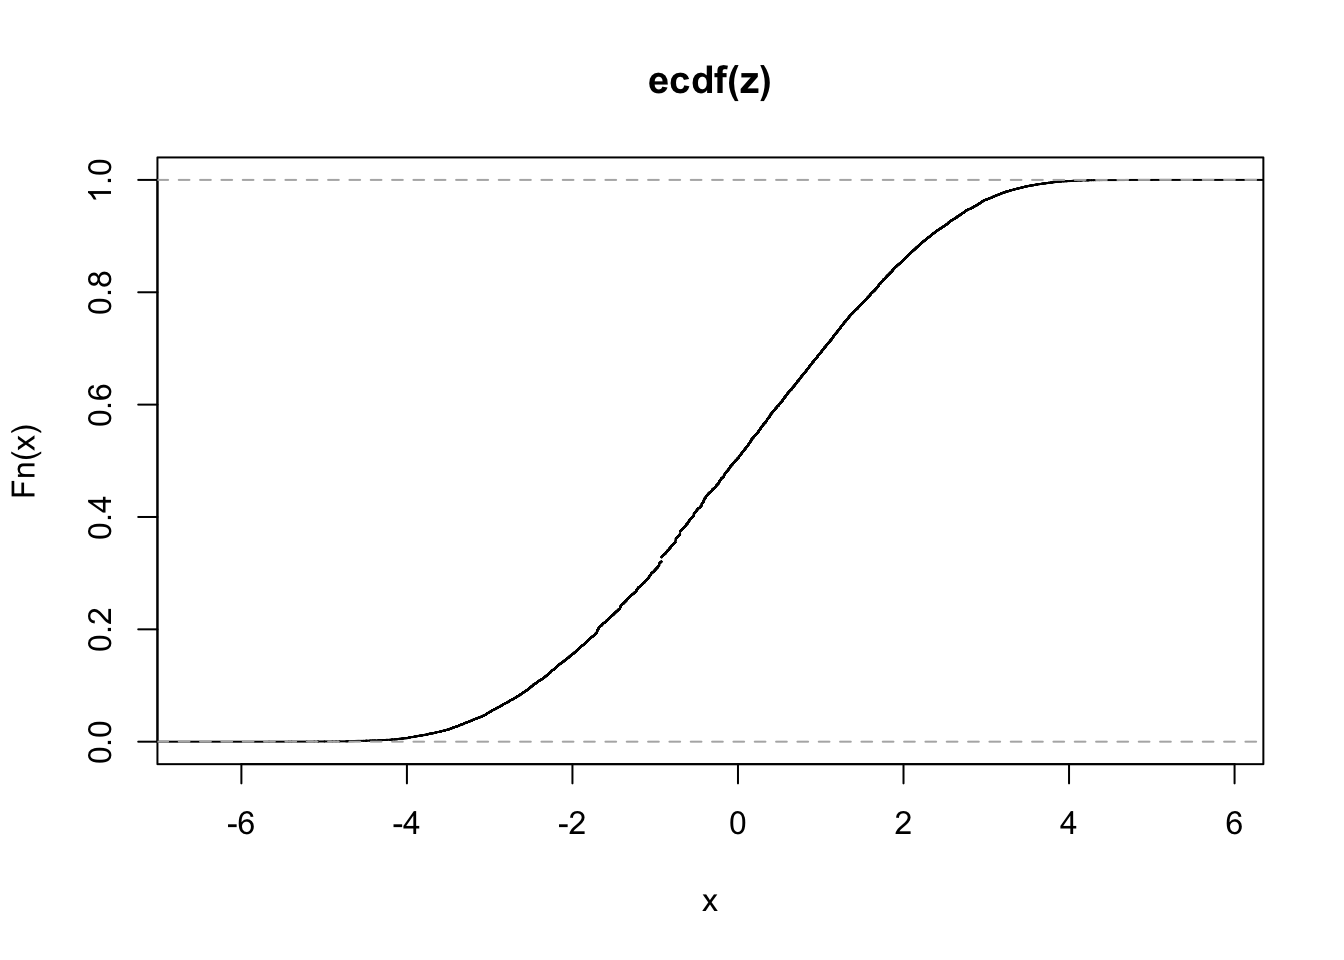
Higher expression
## Remove all zeros
counts.pos = counts[apply(counts, 1, min) > 0, ]
## Number of positive genes
nrow(counts.pos)
[1] 15573w.fit = gdfit(z, gd.ord = 10)
cat(rbind(paste(0 : w.fit$gd.ord, ":"), paste(w.fit$w, ";")))0 : 1 ; 1 : 0.0728018367613604 ; 2 : 1.90276901242466 ; 3 : 0.487348637367077 ; 4 : 2.25733510399727 ; 5 : 0.946549908952156 ; 6 : 1.49164087236214 ; 7 : 0.902213125512984 ; 8 : 0.427623049884403 ; 9 : 0.342914618843403 ; 10 : 0.0111010389151735 ;plot.gdfit(z, w.fit$w, w.fit$gd.ord, breaks = 100)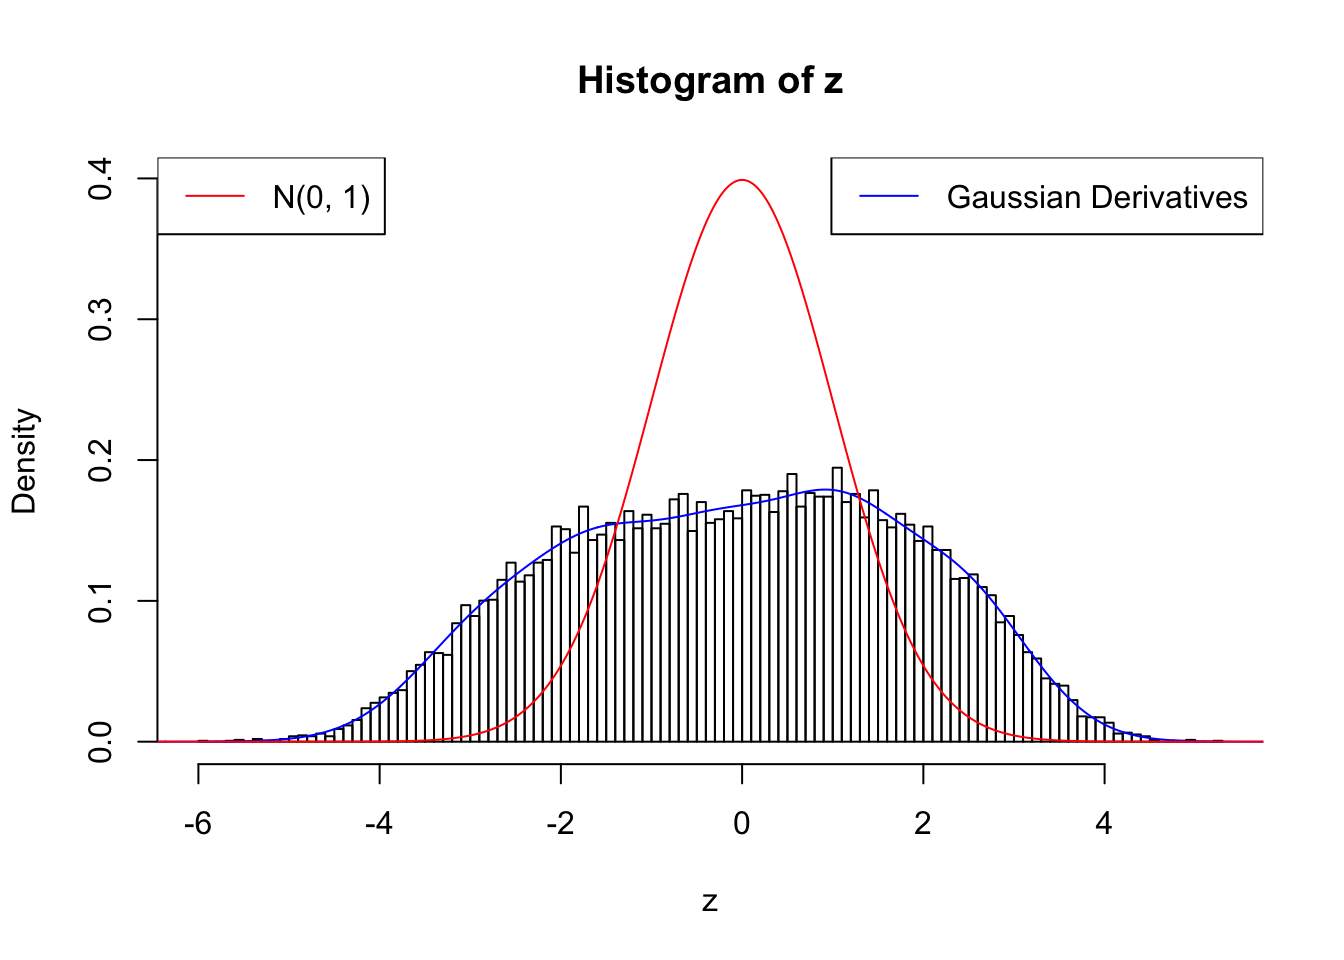
plot.gdfit(z, w.fit$w, w.fit$gd.ord, std.norm = FALSE, breaks = 100)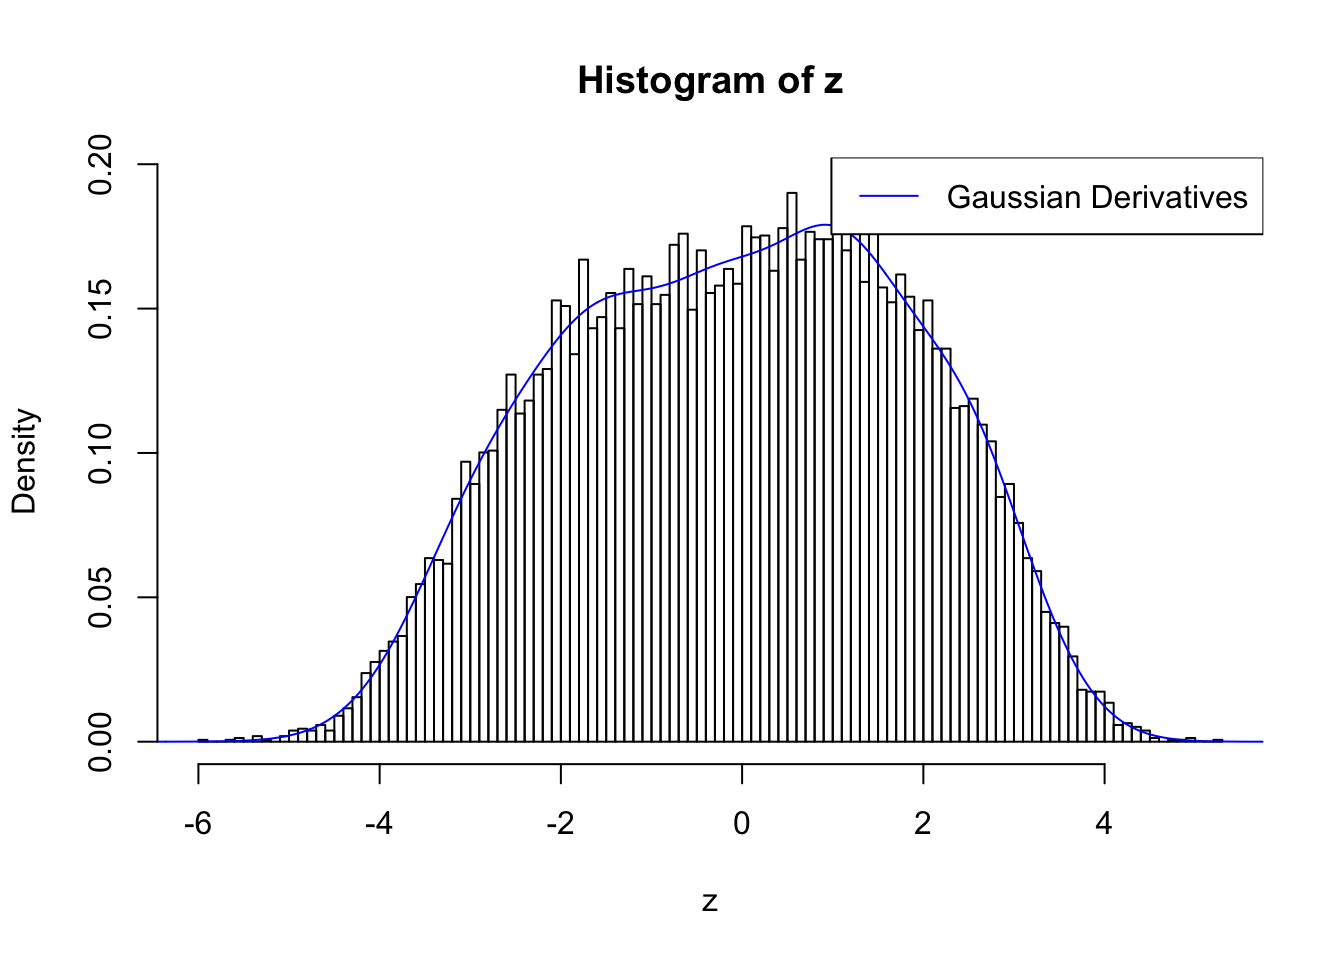
plot(ecdf(z))
plot(betahat, sebetahat, cex = 0.7, pch = 19)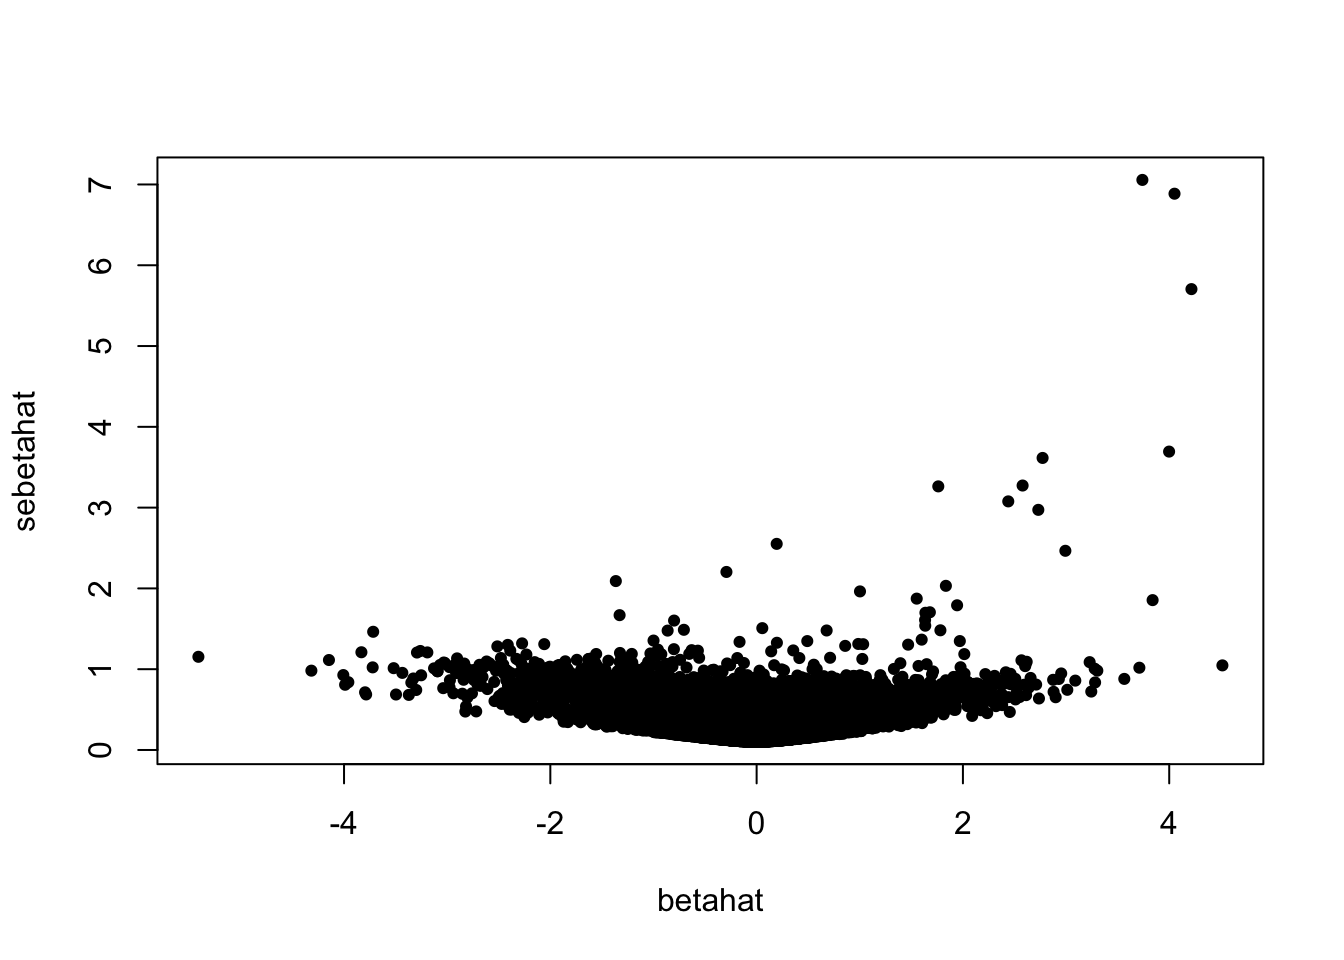
plot(betahat, z, cex = 0.7, pch = 19)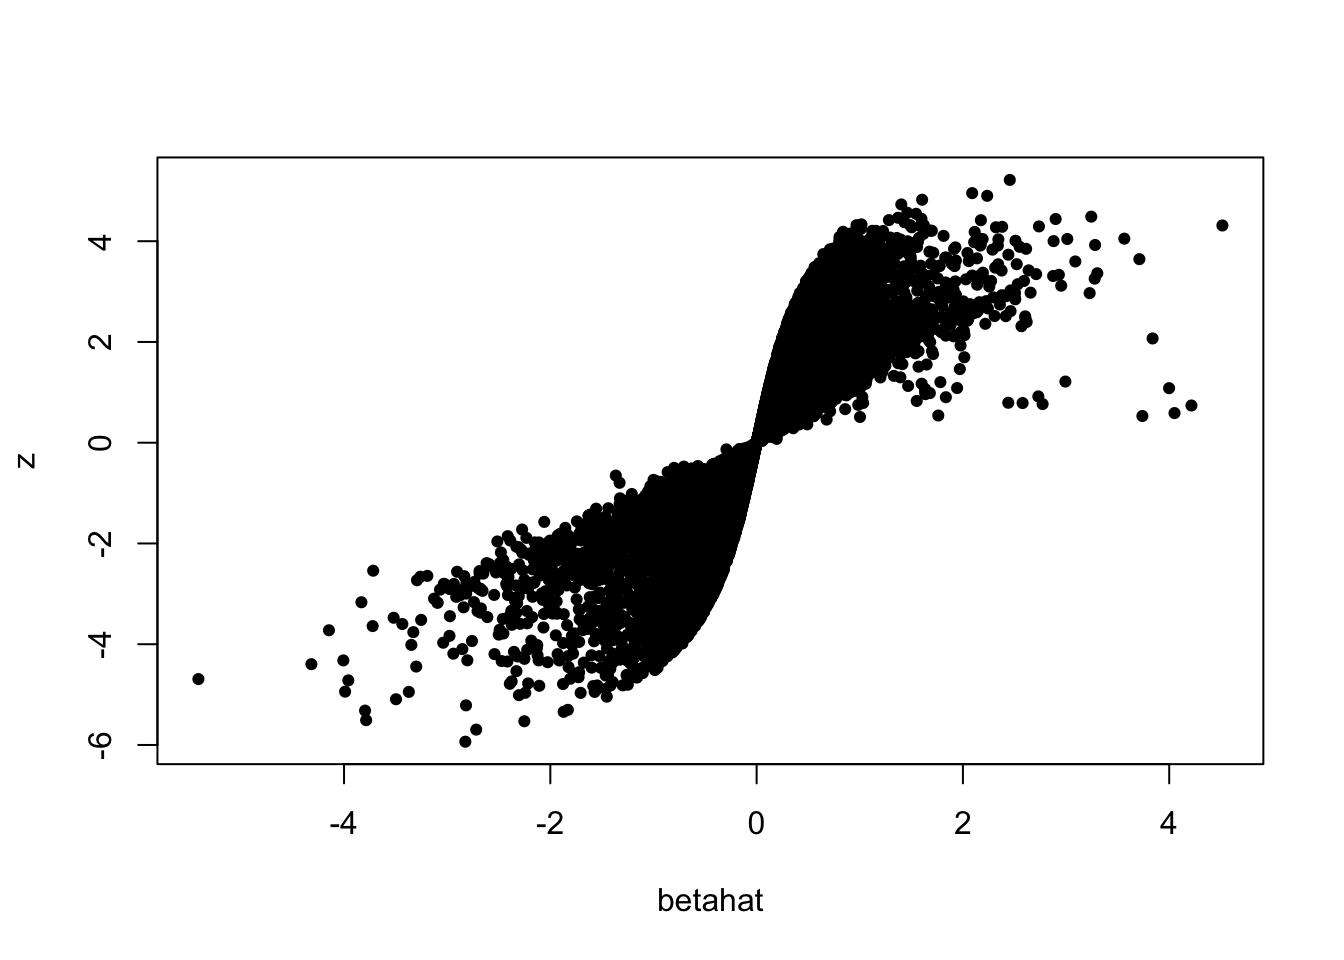
fit.gdash = gdash(betahat, sebetahat)
fit.gdash
$fitted_g
$pi
[1] 1.000000e+00 2.528805e-09 2.400121e-09 2.176702e-09 1.830513e-09
[6] 1.379626e-09 9.118223e-10 5.331532e-10 2.878241e-10 1.520978e-10
[11] 8.278550e-11 4.833400e-11 3.156011e-11 2.470507e-11 2.695691e-11
[16] 5.699032e-11 1.271588e-10 5.089540e-11 1.086290e-11 4.376797e-12
[21] 2.589198e-12 1.842743e-12 1.463609e-12
$mean
[1] 0 0 0 0 0 0 0 0 0 0 0 0 0 0 0 0 0 0 0 0 0 0 0
$sd
[1] 0.000000000 0.007302517 0.010327318 0.014605033 0.020654636
[6] 0.029210066 0.041309272 0.058420132 0.082618544 0.116840265
[11] 0.165237087 0.233680530 0.330474174 0.467361059 0.660948349
[16] 0.934722118 1.321896697 1.869444237 2.643793394 3.738888474
[21] 5.287586788 7.477776948 10.575173576
attr(,"row.names")
[1] 1 2 3 4 5 6 7 8 9 10 11 12 13 14 15 16 17 18 19 20 21 22 23
attr(,"class")
[1] "normalmix"
$w
[1] 1.000000e+00 -5.240201e-02 1.789038e+00 -3.560324e-01 1.788218e+00
[6] -5.932673e-01 7.470306e-01 -4.652369e-01 1.611175e-07 -1.348388e-01
[11] -1.229651e-07
$niter
[1] 3
$converged
[1] TRUEfit.ash = ashr::ash(betahat, sebetahat)
lfsr.ash = ashr::get_lfsr(fit.ash)
sum(lfsr.ash <= 0.05)[1] 3839fit.gdash.ash = ashr::ash(betahat, sebetahat, fixg = TRUE, g = fit.gdash$fitted_g)
lfsr.gdash.ash = ashr::get_lfsr(fit.gdash.ash)
sum(lfsr.gdash.ash <= 0.05)[1] 0pval = (1 - pnorm(abs(z))) * 2
pval.BH = p.adjust(pval, method = "BH")
sum(pval.BH <= 0.05)[1] 3087Session information
sessionInfo()R version 3.4.3 (2017-11-30)
Platform: x86_64-apple-darwin15.6.0 (64-bit)
Running under: macOS High Sierra 10.13.2
Matrix products: default
BLAS: /Library/Frameworks/R.framework/Versions/3.4/Resources/lib/libRblas.0.dylib
LAPACK: /Library/Frameworks/R.framework/Versions/3.4/Resources/lib/libRlapack.dylib
locale:
[1] en_US.UTF-8/en_US.UTF-8/en_US.UTF-8/C/en_US.UTF-8/en_US.UTF-8
attached base packages:
[1] stats graphics grDevices utils datasets methods base
other attached packages:
[1] Rmosek_8.0.69 PolynomF_1.0-1 CVXR_0.94-4 REBayes_1.2
[5] Matrix_1.2-12 SQUAREM_2017.10-1 EQL_1.0-0 ttutils_1.0-1
loaded via a namespace (and not attached):
[1] gmp_0.5-13.1 Rcpp_0.12.14 compiler_3.4.3
[4] git2r_0.20.0 R.methodsS3_1.7.1 R.utils_2.6.0
[7] iterators_1.0.9 tools_3.4.3 digest_0.6.13
[10] bit_1.1-12 evaluate_0.10.1 lattice_0.20-35
[13] foreach_1.4.4 yaml_2.1.16 parallel_3.4.3
[16] Rmpfr_0.6-1 ECOSolveR_0.3-2 stringr_1.2.0
[19] knitr_1.17 locfit_1.5-9.1 rprojroot_1.3-1
[22] bit64_0.9-7 grid_3.4.3 R6_2.2.2
[25] rmarkdown_1.8 limma_3.34.4 ashr_2.2-2
[28] edgeR_3.20.2 magrittr_1.5 MASS_7.3-47
[31] backports_1.1.2 codetools_0.2-15 htmltools_0.3.6
[34] scs_1.1-1 assertthat_0.2.0 stringi_1.1.6
[37] pscl_1.5.2 doParallel_1.0.11 truncnorm_1.0-7
[40] R.oo_1.21.0 This R Markdown site was created with workflowr